I've written in the past about answering the question "where's the market heading?", a question I get asked a LOT! You can read my answer here.
But one of the reasons I started the Property Developer Network, and then created the Property Development Formula course, is that I'm a big believer in teaching people to fish.
Okay, so if you don't know the saying "Feed a man a fish and you feed him for a day, teach a man to fish and you feed him for a lifetime", then that last reference might have gone over your head.
The thing is, last time around I talked a lot about market drivers and indicators and how important they are as part of your property development market research, but I didn't have space to go into detail about how to use that information to build your own crystal ball. So here we go!
First up, a quick refresh on what market drivers and indicators are, as I will be referring to them throughout the article.

Drivers
Drivers are the reasons markets move up or down. An example would be population growth. If you have an area that lots of people are trying to move to, then that pushes up demand, which in term pushes up prices.
Drivers can generally be grouped into two categories - macro and micro. Macro drivers affect the country as a whole, including things like:
Micro drivers, on the other hand, are more concerned with your local geographical area. For example, a single suburb. These will help you to understand exactly what's going on in your area, and how it's likely to affect the product type you're creating as part of your property development strategy.
Some examples are:
Indicators
Indicators take data from the marketplace and present it in an easy to read way. Essentially, though, they lag the market, so are only a way of telling you what has already happened. For example, a sales indicator. It generally takes a few months for sales data to come through after a contract is signed, so any sales indicator is already out of date by the time it's published.
Indices are basically a subset of indicators. They make the indicator data easier to digest by turning it into a graphical form - think infographics. They use indicators to average out what is happening in the market. Which means they lag even further behind, because it takes time to produce the pretty pictures!
Using the phrase "cause and effect", you can see that market drivers usually cause the market to move in a particular direction, and indicators record the effect of that movement on various markers. If you want more examples, check out the article referenced at the start, as I want to focus on where to find the information you need in both categories to build your own crystal ball.
Some Useful Data Sources
Macro driver information is frequently published in the media, and is a popular topic for economic commentators. If you want to go to the source, then check out the Australian Bureau of Statistics as they have lots of great statistics there (what a surprise!).
Another source is Trading Economics. Some information overlaps with the ABS, but they cover a much broader range of both drivers and indicators.
Both the Australian Bureau of Statistics and Trading Economics have data that can be broken down to smaller geographical areas, so spend some time there looking for the information you need.
Your local Council is generally a good source of information for infrastructure proposed in the local area, as well as Infrastructure Pipeline site.
Sales sites, such as Domain and realestate.com.au have plenty of general background information for each suburb. You can also find statistics around sales, demographics and more. You might be surprised what you find when you go digging to assess future property development opportunities!
Data services, such as National Property Data, also provide a lot of good information in this space to help determine supply and demand for the area.
The notion of a "property clock" is also popular in the market, although being an indicator it does lag behind the market by a few months. Heron Todd White produces a range of these every month in their "Month in Review" newsletters. They cover capital cities as well as major regional centres, so are useful for an overview.
For the monetary policy side of things, keep an eye on the Reserve Bank of Australia and APRA for both the data and the background commentary to decisions they make or comments they publish.
There's plenty more information out there, but there's also a limit to how many hours you want to spend on this every month, so I'll leave it there!
Now What?
While it's helpful to click through once and check out a bunch of sites, the real value comes from monitoring the most relevant data on a regular basis. It would be easy to go into data overload at that point, so keep it simple.
Keep an eye on what's happening on the macro level by monitoring the major economic news, but maintain focus on your local area. After all, that's where you're developing, so that's the data most relevant to you.
As a minimum, I suggest you create a list of micro drivers and indicators, and keep track of them monthly. That way you can check each month to see if each one is going up, down or moving sideways compared to the previous month.
Some of the key ones for your area are:
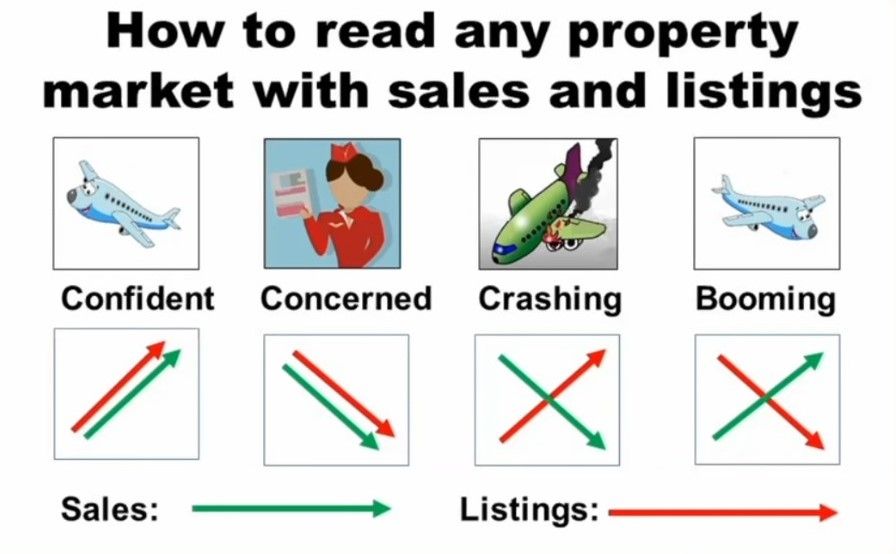
And my all-time favourite hack, courtesy of John Lindemann, is seeing which direction sales and listings are travelling. You can read about this on his website here.
The idea is to work out if sales and listings are rising or falling, then compare those two results to the picture. Straightaway it gives you a sense of where the market is heading. Now, a word of caution - sales data in particular is a lagging indicator, so you need to be watching this data closely, combining it with other information, in order to get a feel for where the market is going. Otherwise you'll end up lagging behind too!
As an example, if you can see sales are rising but the number of listings are falling, then you know you're in a boom market. Vendor expectations are likely to be high, and finding bargains can be tough.
But if listings are rising while sales drop, you have the opposite - the market is starting to crash, so once vendors wake up and realise what's happening, they're likely to be a lot more open to alternative ideas for selling their property.
The important thing here is to be monitoring for changes of direction.
Obviously this is only a brief overview, as you can really go down a rabbit hole once you start looking for this, and drown in information overload. The key is to work out which data is most valuable to your property development business, and monitor it regularly for any changes. That way you won't need to wait for me to do a market update - you'll have your own crystal ball!
But one of the reasons I started the Property Developer Network, and then created the Property Development Formula course, is that I'm a big believer in teaching people to fish.
Okay, so if you don't know the saying "Feed a man a fish and you feed him for a day, teach a man to fish and you feed him for a lifetime", then that last reference might have gone over your head.
The thing is, last time around I talked a lot about market drivers and indicators and how important they are as part of your property development market research, but I didn't have space to go into detail about how to use that information to build your own crystal ball. So here we go!
First up, a quick refresh on what market drivers and indicators are, as I will be referring to them throughout the article.
Drivers
Drivers are the reasons markets move up or down. An example would be population growth. If you have an area that lots of people are trying to move to, then that pushes up demand, which in term pushes up prices.
Drivers can generally be grouped into two categories - macro and micro. Macro drivers affect the country as a whole, including things like:
- unemployment rates
- population growth
- economic strength
- and so on
Micro drivers, on the other hand, are more concerned with your local geographical area. For example, a single suburb. These will help you to understand exactly what's going on in your area, and how it's likely to affect the product type you're creating as part of your property development strategy.
Some examples are:
- local infrastructure being built
- affordability
- supply and demand
- vacancy levels
- demographics
- sales rates
- and so on
Indicators
Indicators take data from the marketplace and present it in an easy to read way. Essentially, though, they lag the market, so are only a way of telling you what has already happened. For example, a sales indicator. It generally takes a few months for sales data to come through after a contract is signed, so any sales indicator is already out of date by the time it's published.
Indices are basically a subset of indicators. They make the indicator data easier to digest by turning it into a graphical form - think infographics. They use indicators to average out what is happening in the market. Which means they lag even further behind, because it takes time to produce the pretty pictures!
Using the phrase "cause and effect", you can see that market drivers usually cause the market to move in a particular direction, and indicators record the effect of that movement on various markers. If you want more examples, check out the article referenced at the start, as I want to focus on where to find the information you need in both categories to build your own crystal ball.
Some Useful Data Sources
Macro driver information is frequently published in the media, and is a popular topic for economic commentators. If you want to go to the source, then check out the Australian Bureau of Statistics as they have lots of great statistics there (what a surprise!).
Another source is Trading Economics. Some information overlaps with the ABS, but they cover a much broader range of both drivers and indicators.
Both the Australian Bureau of Statistics and Trading Economics have data that can be broken down to smaller geographical areas, so spend some time there looking for the information you need.
Your local Council is generally a good source of information for infrastructure proposed in the local area, as well as Infrastructure Pipeline site.
Sales sites, such as Domain and realestate.com.au have plenty of general background information for each suburb. You can also find statistics around sales, demographics and more. You might be surprised what you find when you go digging to assess future property development opportunities!
Data services, such as National Property Data, also provide a lot of good information in this space to help determine supply and demand for the area.
The notion of a "property clock" is also popular in the market, although being an indicator it does lag behind the market by a few months. Heron Todd White produces a range of these every month in their "Month in Review" newsletters. They cover capital cities as well as major regional centres, so are useful for an overview.
For the monetary policy side of things, keep an eye on the Reserve Bank of Australia and APRA for both the data and the background commentary to decisions they make or comments they publish.
There's plenty more information out there, but there's also a limit to how many hours you want to spend on this every month, so I'll leave it there!
Now What?
While it's helpful to click through once and check out a bunch of sites, the real value comes from monitoring the most relevant data on a regular basis. It would be easy to go into data overload at that point, so keep it simple.
Keep an eye on what's happening on the macro level by monitoring the major economic news, but maintain focus on your local area. After all, that's where you're developing, so that's the data most relevant to you.
As a minimum, I suggest you create a list of micro drivers and indicators, and keep track of them monthly. That way you can check each month to see if each one is going up, down or moving sideways compared to the previous month.
Some of the key ones for your area are:
- number of sales
- number of listings
- amount of jobs
- unemployment rate
And my all-time favourite hack, courtesy of John Lindemann, is seeing which direction sales and listings are travelling. You can read about this on his website here.
The idea is to work out if sales and listings are rising or falling, then compare those two results to the picture. Straightaway it gives you a sense of where the market is heading. Now, a word of caution - sales data in particular is a lagging indicator, so you need to be watching this data closely, combining it with other information, in order to get a feel for where the market is going. Otherwise you'll end up lagging behind too!
As an example, if you can see sales are rising but the number of listings are falling, then you know you're in a boom market. Vendor expectations are likely to be high, and finding bargains can be tough.
But if listings are rising while sales drop, you have the opposite - the market is starting to crash, so once vendors wake up and realise what's happening, they're likely to be a lot more open to alternative ideas for selling their property.
The important thing here is to be monitoring for changes of direction.
Obviously this is only a brief overview, as you can really go down a rabbit hole once you start looking for this, and drown in information overload. The key is to work out which data is most valuable to your property development business, and monitor it regularly for any changes. That way you won't need to wait for me to do a market update - you'll have your own crystal ball!